
Sales performance is a critical aspect of any business, as it directly impacts revenue and growth. To effectively monitor and manage sales performance, tracking key performance indicators (KPIs) is essential. Sales KPIs provide valuable insights into the effectiveness of sales strategies, tactics, and individual performance.
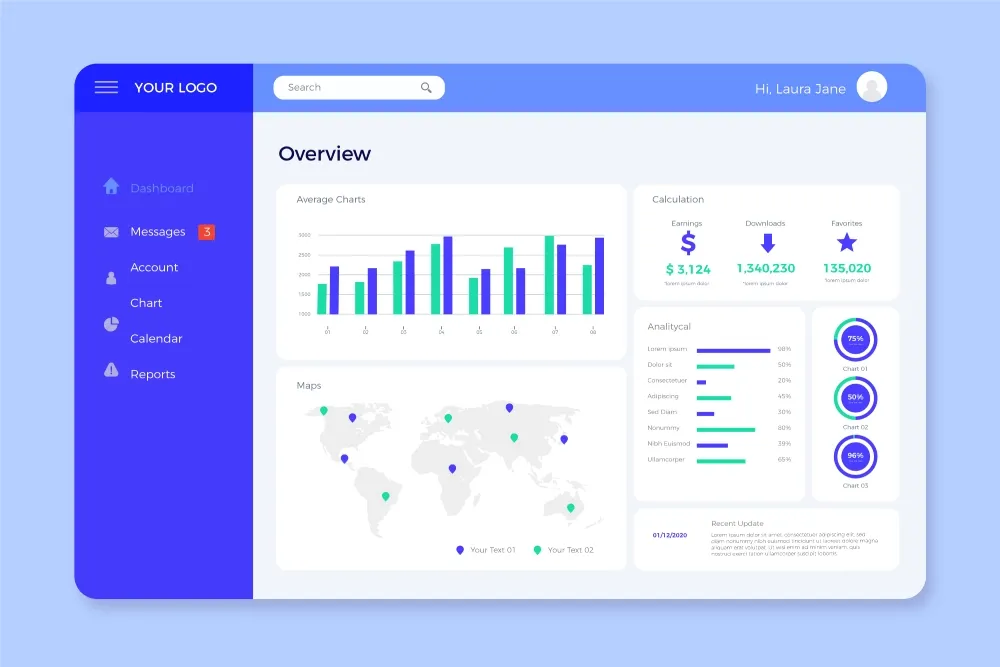
A sales dashboard is a visual representation of sales KPIs, designed to provide a real-time snapshot of sales performance. It consolidates data from various sources, such as CRM systems, marketing automation tools, and financial reports, into a single view. Sales dashboards help businesses make informed decisions, optimize sales processes, and drive revenue growth.
In this comprehensive guide, SYSINT will explore the importance of tracking sales KPIs, the benefits of using a sales dashboard, and the key metrics that should be included in a sales dashboard. By the end of this guide, you will have a solid understanding of how to master sales performance through the use of sales dashboards and KPIs.
Sales Performance Metrics
There are several key performance indicators (KPIs) that businesses can use to measure sales performance. Some of the most important sales performance metrics include:
- Sales revenue: This metric measures the total amount of revenue generated by a sales team over a given period.
- Sales growth: This metric measures the percentage increase or decrease in sales revenue over a specific period.
- Conversion rate: This metric measures the percentage of leads that convert into paying customers.
- Average deal size: This metric measures the average value of each sale.
- Sales pipeline: This metric shows the number of deals in each stage of the sales process, providing insight into the overall health of the sales pipeline.
- Sales cycle length: This metric measures the time it takes for a lead to become a paying customer.
- Customer acquisition cost (CAC): This metric measures the total cost of acquiring a new customer, including marketing and sales expenses.
- Customer lifetime value (CLV): This metric measures the total amount of revenue a customer is expected to generate over their lifetime.
Tracking these metrics is significant as it provides businesses with actionable insights into the effectiveness of their sales strategies and tactics.
By monitoring and analyzing sales performance metrics regularly, businesses can identify areas for improvement, make data-driven decisions, and optimize sales processes to increase revenue and profitability.
Additionally, tracking these metrics helps businesses to set realistic goals, measure progress toward those goals, and hold sales teams accountable for their performance.
Revenue Growth Analysis
Revenue growth is a critical metric for any business, as it indicates the overall health and success of the organization. To effectively analyze revenue growth trends, there are several metrics that businesses can use:
- Year-over-year (YoY) revenue growth: This metric compares the current year's revenue to the same period in the previous year, showing the percentage increase or decrease in revenue.
- Quarter-over-quarter (QoQ) revenue growth: This metric compares the current quarter's revenue to the previous quarter, showing the percentage increase or decrease in revenue.
- Monthly recurring revenue (MRR): This metric measures the predictable, recurring revenue generated by subscriptions or ongoing service contracts.
- Customer lifetime value (CLV): This metric measures the total amount of revenue a customer is expected to generate over their lifetime.
- Average revenue per user (ARPU): This metric measures the average revenue generated per user or customer.
To analyze revenue growth trends, businesses can create charts or graphs to visualize changes in revenue over time. They can also identify patterns and trends in revenue growth, such as seasonal fluctuations or changes in customer behavior.
Businesses can use this information to make data-driven decisions, optimize sales and marketing strategies, and adjust pricing or product offerings to drive revenue growth.
By tracking revenue growth metrics regularly, businesses can measure progress toward revenue goals and make adjustments as needed to stay on track.
Conversion Rates Tracking
Tracking conversion rates is crucial for businesses to measure the effectiveness of their sales and marketing efforts. Metrics for measuring conversion rates include conversion rate percentage, lead-to-customer conversion rate, and website conversion rate. By monitoring these metrics, businesses can identify areas for improvement and make data-driven decisions to optimize their sales and marketing strategies.
Pipeline Management Dashboard
Creating a pipeline management dashboard can be a complex process, but with the right metrics and tools, it can provide valuable insights into your sales process and help you make informed decisions.
Here are some steps to create a pipeline management dashboard:
- Determine the purpose
- Identify key metrics
- Choose a dashboard tool
- Design the dashboard with user-friendliness in mind
- Test and refine
Lead-to-Opportunity Ratio
The lead-to-opportunity ratio is a crucial metric that sales teams use to measure the effectiveness of their lead-generation efforts. It provides insight into how many of the leads generated by the team are being converted into opportunities, which are then passed on to the sales team for further follow-up and nurturing. This ratio helps the team identify areas where they may need to improve their lead qualification process or adjust their marketing strategies to better target the right types of leads.
To calculate the lead-to-opportunity ratio, simply divide the number of opportunities created by the number of leads generated in a given period. For example, if your team generated 100 leads in a month and created 20 opportunities from those leads, your lead-to-opportunity ratio would be 20%. It's important to track this metric over time to identify trends and make adjustments as needed to ensure that the sales team is receiving a steady stream of high-quality opportunities to pursue. By monitoring this ratio, sales leaders can make data-driven decisions to optimize their team's performance and drive revenue growth.
Sales Cycle Duration
Tracking the sales cycle duration is critical for sales teams to evaluate their effectiveness in closing deals and to identify areas where they can improve efficiency. The sales cycle duration is the length of time it takes for a lead to become a customer, from the initial contact to the final sale. Measuring this metric is important because it provides insight into how long it takes the sales team to move leads through the pipeline and close deals. Sales leaders can use this data to identify bottlenecks in the sales process and make data-driven decisions to optimize the sales cycle and increase revenue.
Sales Forecasting Tools
Sales forecasting is a crucial aspect of any business strategy as it helps to predict future revenue, identify potential growth opportunities, and plan for future expenses. The benefits of sales forecasting extend beyond financial planning as it also helps to identify potential challenges and opportunities in the market landscape.
To accurately forecast sales, businesses can use a variety of tools and techniques such as historical data analysis, market research, and trend analysis. By utilizing these tools, businesses can make informed decisions and stay ahead of their competition.
Customer Acquisition Cost
Customer Acquisition Cost (CAC) is the cost of acquiring a new customer for a business. It measures the total cost that a business incurs to acquire a new customer, including marketing expenses, sales commissions, and other related costs. Understanding CAC is important because it helps businesses to determine the effectiveness and profitability of their marketing strategies. To calculate CAC, businesses can divide their total sales and marketing costs by the number of new customers acquired during a specific period. To reduce CAC, businesses can focus on improving their marketing strategies, targeting the right audience, and enhancing their sales process to increase conversion rates. Other strategies can include improving customer retention, maximizing customer lifetime value, and leveraging social media and other digital marketing channels.
Sales Team Productivity Metrics
Metrics for measuring sales team productivity may include:
- Sales revenue: This metric measures the total amount of sales revenue generated by the sales team over a specific period.
- Sales conversion rate: This metric measures the percentage of leads or prospects that convert into actual sales.
- Sales cycle length: This metric measures the length of time it takes for a lead to convert into a sale.
- Lead response time: This metric measures how quickly the sales team responds to new leads or inquiries.
- Pipeline metrics: This includes metrics such as the number of leads in the pipeline, the value of the opportunities, and the stage of each opportunity.
Tips for improving sales team productivity may include:
- Providing regular training and coaching: Regular training and coaching sessions can help sales reps improve their skills and techniques, leading to increased productivity and better results.
- Setting clear goals and targets: Clearly defined goals and targets can motivate sales reps and provide a clear focus on what needs to be achieved.
- Utilizing sales technology: Sales technology such as CRM systems, marketing automation, and sales enablement tools can help streamline processes and improve efficiency.
- Encouraging teamwork and collaboration: Encouraging teamwork and collaboration can foster a supportive and productive environment that helps individuals achieve their goals.
- Measuring and analyzing performance: Regularly measuring and analyzing performance metrics can help identify areas of improvement, allowing for targeted training and coaching.
Sales Activity Tracking
Tracking sales activities is crucial for any business that wants to improve its sales performance. It allows sales teams to measure their progress toward their goals, identify areas of improvement, and make data-driven decisions.
By tracking metrics such as the number of calls made, emails sent, meetings booked, demos conducted, and deals closed, sales teams can gain insights into their performance and adjust their strategies accordingly.
Moreover, tracking sales activities helps managers to identify top-performing reps and provide coaching and support to those who are struggling. Overall, sales activity tracking is an essential component of any successful sales strategy.
Sales Territory Analysis
Sales territories are geographical areas assigned to sales teams or individuals to sell products or services. They can be defined by region, industry, product line, or any other relevant criteria. Analyzing sales territories is important because it allows sales teams to identify which territories are performing well and which ones need improvement.
Metrics for analyzing sales territories may include total sales revenue, sales growth rate, customer acquisition rate, customer retention rate, and average deal size. By analyzing these metrics, sales teams can identify the most profitable territories, allocate resources effectively, and make informed decisions about where to focus their sales efforts.
Additionally, sales territory analysis allows managers to identify areas that require additional support or resources, and to adjust strategies accordingly.
Sales Funnel Visualization
Visualizing the sales funnel is crucial for understanding the customer journey and identifying areas for improvement. It allows sales teams to track the progress of leads as they move through the funnel, from initial interest to final purchase. By visualizing the sales funnel, sales teams can identify bottlenecks or areas where prospects are dropping off, and adjust their strategies to convert more leads into customers.
Moreover, a well-designed sales funnel visualization can provide insights into the effectiveness of each stage of the sales process, allowing sales teams to focus on the most impactful activities. Sales funnel visualization can also help managers to identify areas where sales reps may require additional training or support, and to allocate resources effectively.
Sales by Product/Service
Tracking sales by product or service is important for understanding which offerings are driving revenue and which ones may need additional attention. It allows sales teams to identify top-performing products or services and allocate resources accordingly, such as increasing marketing efforts or investing in product development.
Moreover, tracking sales by product/service can help businesses make informed decisions about pricing strategies, promotions, and inventory management. By understanding which products or services are selling well and which ones are underperforming, sales teams can adjust their strategies to maximize revenue and profitability.
Metrics for measuring sales by product/service may include total revenue by product/service, sales growth rate, customer acquisition rate, customer retention rate, average deal size by product/service, and profit margin by product/service.
Sales by Channel/Partner
Sales channels and partners are important components of a business's sales strategy. Sales channels refer to the various methods or platforms through which a business sells its products or services, such as direct sales, online marketplaces, or retail stores.
Partners, on the other hand, are third-party individuals or organizations that help to sell a business's products or services. This may include resellers, distributors, affiliates, or referral partners.
Measuring sales by channel/partner is essential for understanding which channels or partners are driving revenue and which ones may need additional attention. Metrics for measuring sales by channel/partner may include total revenue by channel/partner, sales growth rate, customer acquisition rate, customer retention rate, average deal size by channel/partner, and profit margin by channel/partner.
Overall, effective sales KPI tracking is a critical aspect of any successful sales strategy. By incorporating it into their processes and utilizing the insights gained, businesses can drive revenue growth, improve customer acquisition and retention, and ultimately achieve their sales goals.
SYSINT is an eCommerce development agency that offers data business analytics services and analyzes KPIs and metrics. We also offer custom software development services, which include developing a sales dashboard. Our conversion rate optimization (CRO) services, can help to increase your website's conversion rate and enhance other KPIs. We also provide a Data Studio Dashboard to track main KPIs and ensure continuous interface optimization.
Please don't hesitate to contact us to learn more about how our services can help with your sales dashboard and sales KPIs. We look forward to hearing from you soon!
'%3e%3cellipse%20cx='508.5'%20cy='387.5'%20rx='324.5'%20ry='234.5'%20fill='url(%23paint0_linear_74_1900)'/%3e%3c/g%3e%3cdefs%3e%3cfilter%20id='filter0_f_74_1900'%20x='0'%20y='-31'%20width='1017'%20height='837'%20filterUnits='userSpaceOnUse'%20color-interpolation-filters='sRGB'%3e%3cfeFlood%20flood-opacity='0'%20result='BackgroundImageFix'/%3e%3cfeBlend%20mode='normal'%20in='SourceGraphic'%20in2='BackgroundImageFix'%20result='shape'/%3e%3cfeGaussianBlur%20stdDeviation='92'%20result='effect1_foregroundBlur_74_1900'/%3e%3c/filter%3e%3clinearGradient%20id='paint0_linear_74_1900'%20x1='227.37'%20y1='272.209'%20x2='619.387'%20y2='679.264'%20gradientUnits='userSpaceOnUse'%3e%3cstop%20stop-color='%23863CF9'/%3e%3cstop%20offset='0.239583'%20stop-color='%23B887F4'/%3e%3cstop%20offset='0.494792'%20stop-color='%239FB4FC'/%3e%3cstop%20offset='0.776042'%20stop-color='%23B7E4BB'/%3e%3cstop%20offset='1'%20stop-color='%23FCFD64'/%3e%3c/linearGradient%3e%3c/defs%3e%3c/svg%3e)